Lizee · RMS · 2023
Unlocking new features through data tables
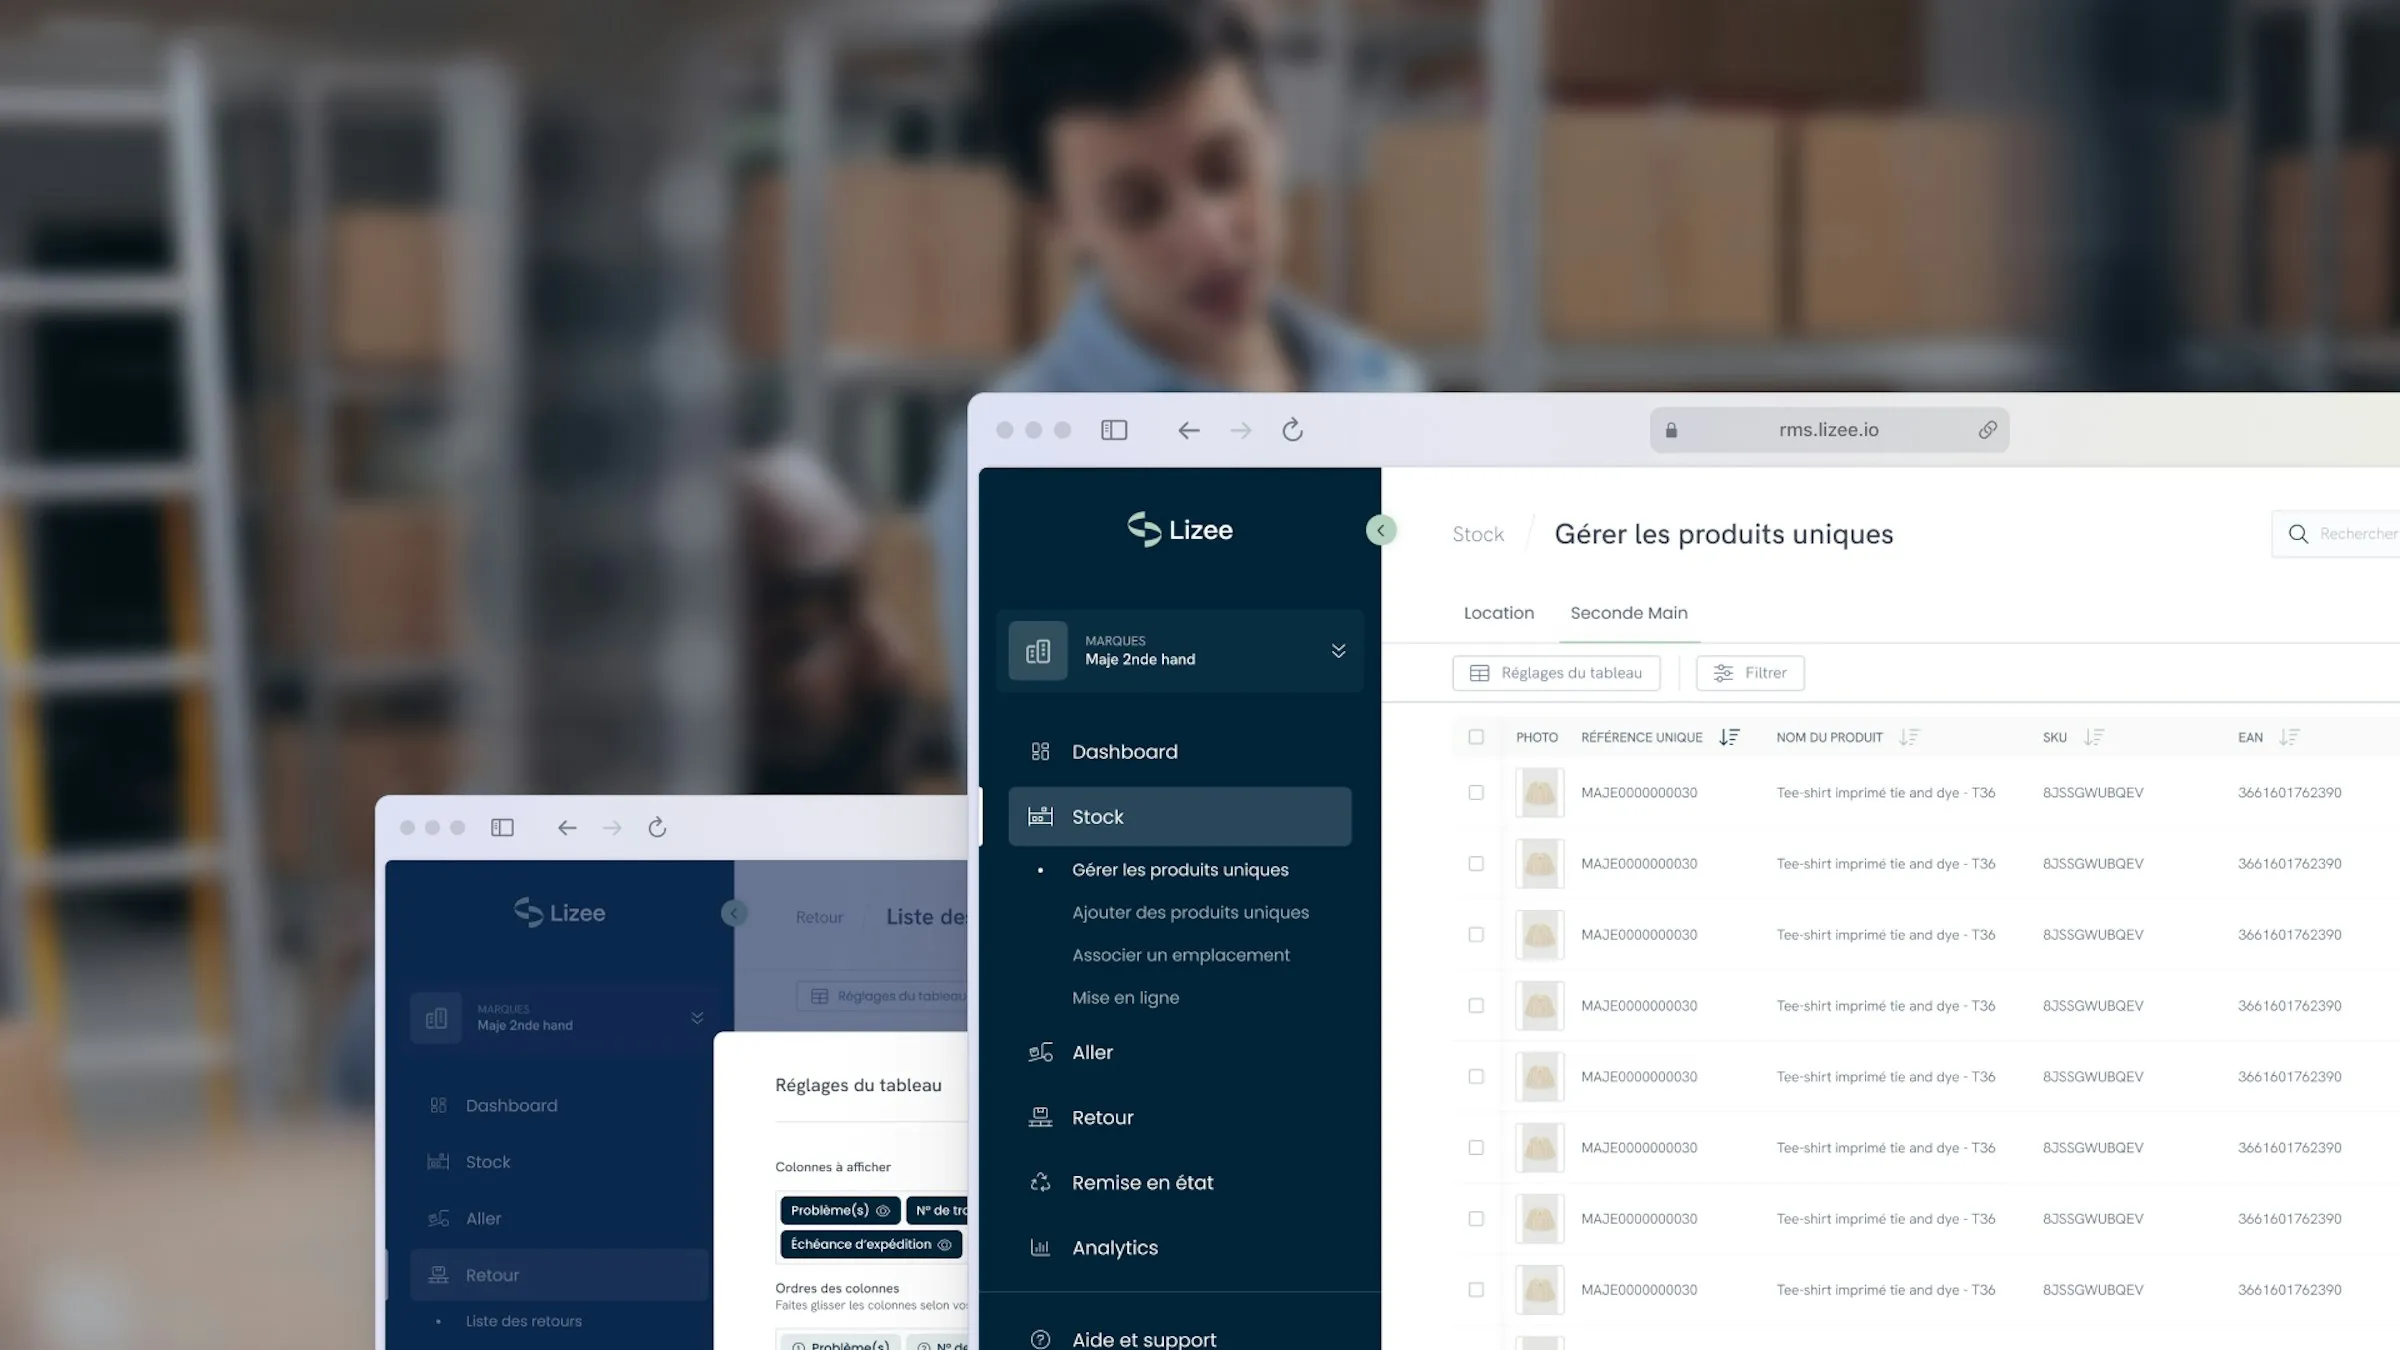
Redesigning Lizee’s RMS data tables: research (Mobbin), Maze testing (8.9/10) and a flexible table component in the design system, rolled out progressively across 10 tables.
Context
In peak season, warehouse roles (managers, operators, after-sales leads) need to streamline their day-to-day operations in the RMS. Yet the tables were hard to use: no bulk actions, information hidden below the scroll, an imperfect column hierarchy and awkward sorting.
Understanding the problem
- What problem? Tables that were barely usable or configurable, across several heterogeneous table types.
- Why? Unify their style and use, and let people filter, pick and order columns to tailor their workspace.
- For whom? First, the heaviest users of the tool: warehouse operators and managers.
- Jobs to be done? Filter and sort on a criterion to find information faster; choose which columns show and in what order; and keep that customisation from one session to the next.
Stepping back
An opportunity assessment (customer importance 2/5, size 4/5, market differentiation 3/5, internal impact 4/5) put the need as moderate but broad, with a real internal productivity gain. With productivity a core pillar, Lizee decided to invest. Tracked KPIs: share of default versus customised tables, number of customisations per month, time spent customising, and bounce rate on table pages.
Ideation
Interviews (a logistics lead, an after-sales lead, operators) and an internal inventory of table-based features confirmed the hypotheses: bulk selection and edits, column sorting, better search, category filters, view customisation. Through Mobbin, a review of dozens of table interfaces surfaced proven UX patterns and reinforced the choices.
Wireframe and prototype
Effort focused first on the most critical feature. Components and mockups were produced in the design system, then tested with an internal panel through Maze.
User testing
The Maze study showed real simplicity and almost fully completed flows, but also some unreachable click zones and insufficient contrast on interaction. Overall score 8.9/10. These insights made it possible to fix the elements causing the most friction.
Progressive rollout
Several weeks of iteration were needed to land a flexible table component in the design system, leaving full latitude to compose tables. Once validated, the mockups were implemented progressively in the app, staying responsive to adjustments while planning the features that would build on the redesign.
Impact
Since launch the feedback has been positive: beyond the practical gains, new features were unlocked by the table’s capabilities, and other needs became easier to address. In numbers: 10 tables redesigned, 24 users in the study, 8.9/10 satisfaction, a 72.8 usability score, and 29 Figma variants across cells and rows.